Year of eBird
As 2019 started to wind down, I found myself doing the New Year cleanout. You know the tasks – going through the old planner to transfer dates and important information to the new planner; doing the annual purge of emails; tallying up annual stats for how much I exercised (not enough), what I ate (too much of everything not healthy), how much I spent (WAY too much), how many books I read (over 100 for the first time ever!), and of course, how many birds I saw (not as many as I had hoped, but more than I expected).
Like so many other birders, I use eBird, a website and mobile application produced by the Cornell Lab of Ornithology. For those who are unfamiliar, let me quote the eBird website:
eBird is the world’s largest biodiversity-related citizen science project, with more than 100 million bird sightings contributed each year by eBirders around the world. A collaborative enterprise with hundreds of partner organizations, thousands of regional experts, and hundreds of thousands of users, eBird is managed by the Cornell Lab of Ornithology.
eBird data document bird distribution, abundance, habitat use, and trends through checklist data collected within a simple, scientific framework. Birders enter when, where, and how they went birding, and then fill out a checklist of all the birds seen and heard during the outing. eBird’s free mobile app allows offline data collection anywhere in the world, and the website provides many ways to explore and summarize your data and other observations from the global eBird community. (From https://ebird.org/about)
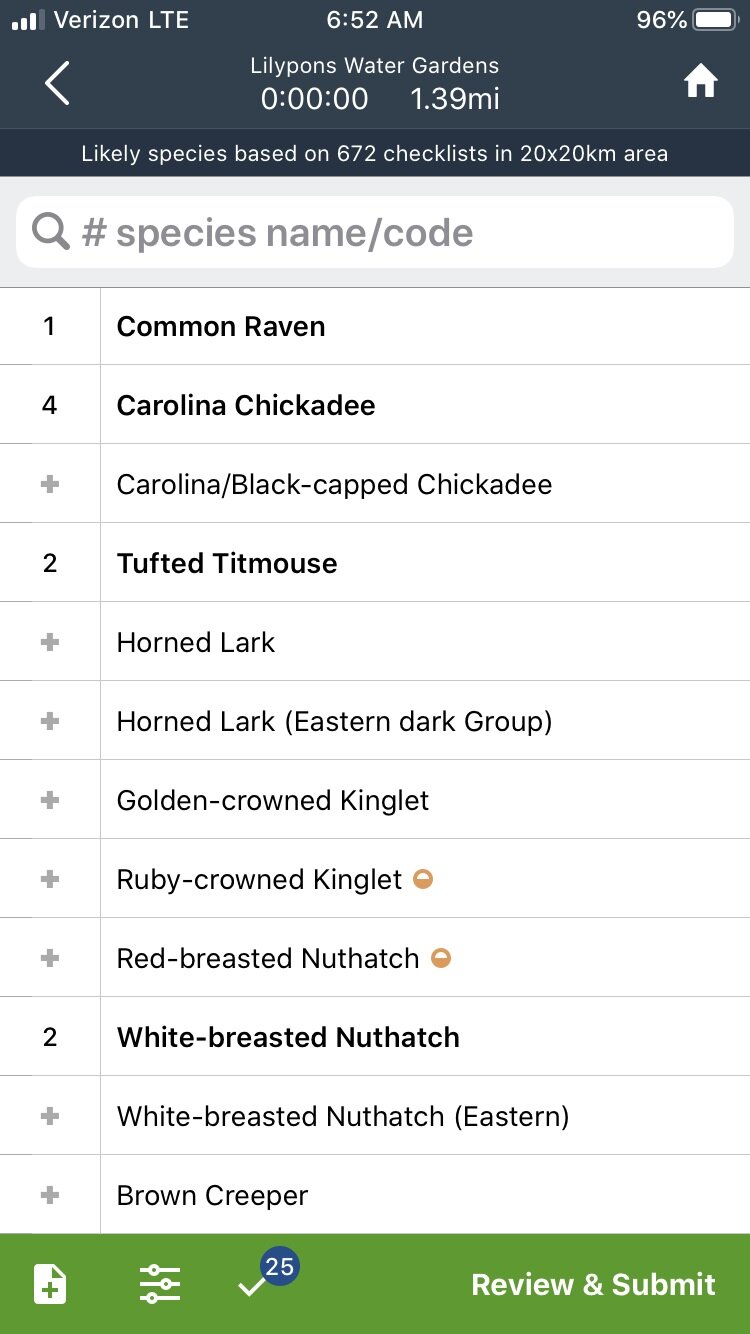
eBird is both a convenient mobile app and desktop website, allowing birders to input sightings in the field as they are seeing them, and then sort through the data and add media (pictures, audio files, videos) to the bird species once they get home and download the media. One of the features that I like and hate at the same time is how the software is “time and place” sensitive, limiting the list shown to those birds that are known to visit a certain location at a certain time of the year. While the entire bird list is available, those birds that are considered “rare” or “infrequent” for the time or place are designated with a symbol to make you aware of the classification. Those with a “rare” designator will, according to the documentation on the website, require more information to be collected, such as a detailed description of the bird and environment it was found in, and hopefully a photograph to confirm the species. I have had a few “interactions” (the term used very loosely) with the eBird volunteer staff with regards to rare bird sightings, and all I will say on the topic is their viewpoint seems to be very untrusting. One interaction was very unpleasant and left a very bad taste in my mouth with regards to the entire eBird platform. Essentially, their viewpoint is that regardless of any information, descriptions, and observations you document, if you did not get a perfect close-up photograph with a million-dollar camera to support your “claim” of a sighting, then they invalidate your list and make it non-public. The information still shows in your personal listings, but scientists will be unaware of its existence. Another issue I have is that what makes a species “rare” seems arbitrary and nonflexible, taken from historical data but not necessarily current patterns, such as weather or food abundances. A bird that was common yesterday could be considered rare today because the calendar hit an unidentified date, which doesn’t take into account that bird migration changes from year to year, season to season. But enough of my opinions – in the grand scheme of things, the software has allowed scientists to collect data from around the world that they would have been unable to collect otherwise. Citizen Science is real science.
Having all of this information at your fingertips can be a little daunting, but knowing you are adding to the scientific knowledge base makes the effort worth it, too. Plus, the website gives you a lot of tools to help find birds, to know what to expect at birding hotspots, and once collected, how to manipulate your own data.
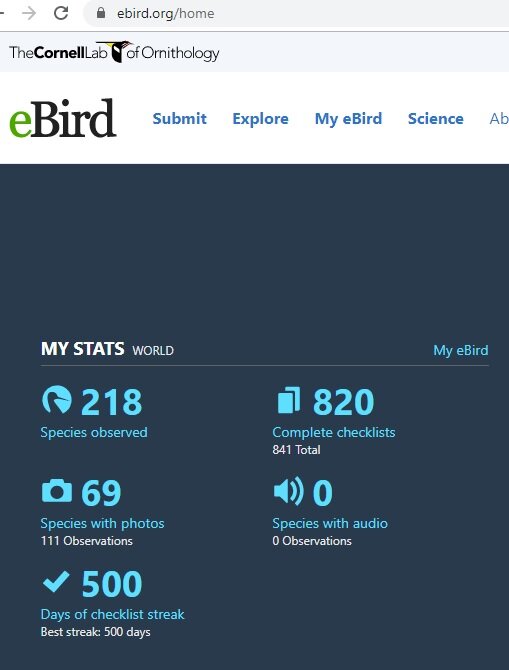
I have been using eBird daily for over a year now. (Edit: as I prepare to post this, I realize that today is my 500th day in a row of using eBird!) Some days are literally ten minutes staring out the back window at the bird feeders. Other days are multiple lists taken throughout the day. Here’s a look at some of the data gleaned from my account…
2019 stats and Life stats
2019 Life
Days of eBird 365 486 days in a row, starting 9/2/2018
No. of checklists 649 817
Total time actively eBirding 22,587 min. 30,377 min. (since 7/18/2018)
No. of species 210 229 (97 added in 2019)
No. of individual sites 102 111
No. of states/ birded 14 14
Species photographers 69 69
Through the report section of the website, one can gather information on how many species were seen each month, how many lists were submitted each month, how many total birds were counted each month, including a breakdown of totals of each species by month. The level on data collected and reported back is nearly infinite, making it fun to just sort through the reports and lists of information.
I am aware many people do not use eBird and have no intentions of starting, but if you are looking for a mobile device application that will help you track and record your sightings, I highly recommend trying out the free eBird app. Not only does it accomplish your goals, but is helps scientists collect data for future research!
(Disclaimer: The application is free to use, and I was not compensated in any way for this review. I am not paid by eBird or the Cornell Lab of Ornithology, and all opinions contained herein are solely the mine.)


